Explore the world of financial trading and
gain the knowledge and tools for success with our expertly
written articles and blogs.

How to leverage tools and indicators for better trading decisions

What separates the pros from the newbies in trading is having a solid toolkit, charts, indicators, and platforms that turn chaos into clarity.
This isn’t about memorizing every tool out there. It’s about knowing how to use a few key ones well. Let’s break it down, trader to trader, and talk about how to make these tools work for you.
The Mental Game: Why Tools Keep You Sane :
Before we geek out on indicators, let’s talk about the headspace. Trading is an emotional rollercoaster, greed when you’re up, panic when you’re down. Tools and indicators are like your wise old mentor, cutting through the noise.
Take a plummeting stock. Your gut screams, “Get out!” But then you check the Relative Strength Index (RSI), and it’s sitting at 25, way oversold. Suddenly, you’re thinking bounce, not crash. That’s the power of data. It’s not about ignoring your instincts; it’s about giving them a reality check.
Tools vs. Indicators: What’s What?
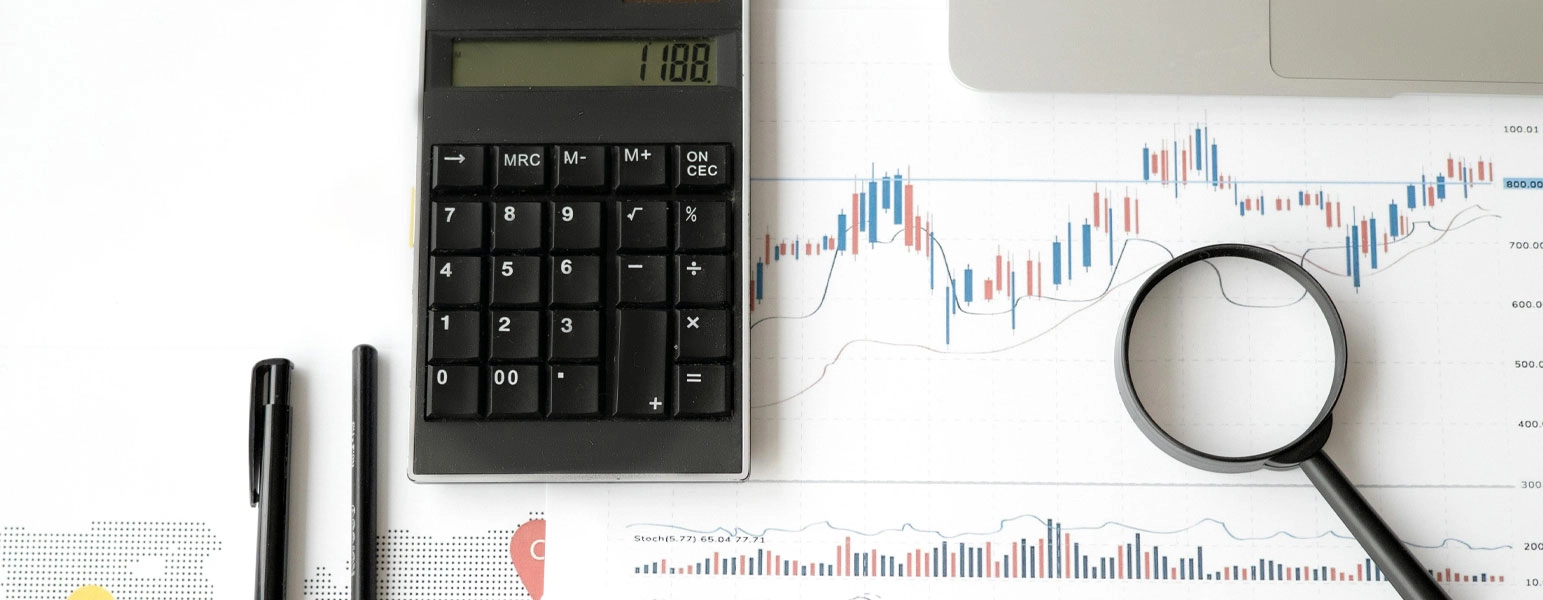
Tools are the platforms you use, think Trading View, Meta Trader, or any fancy software your friend swears by. Indicators are the match bits, like Moving Averages or Bollinger Bands, that crunch price and volume data to spot patterns. Tools are your workshop, indicators are your hammers and saws. You need both to build something solid.
The Must-Have Tools in My Trading Arsenal
Over the years, a few stand out for getting the job done without overcomplicating things. Here’s what you need on your desk.
1. Charting Platforms
Trading View is like a Swiss Army knife for traders, clean charts, real-time data, and enough customization to make your head spin. You can flip between timeframes and setting alerts. Meta Trader 4/5 is another go-to, especially for forex folks. Use their back testing to see if your genius strategy would’ve worked last year before you bet the farm.
2. Economic Calendars
Markets don’t move in a vacuum. A Fed rate hike or a jobs report can flip the script in seconds. Check Forex Factory or Investing.com every morning to know what’s coming. It’s like reading the weather before sailing, you don’t want to get caught in a storm.
3. Risk Management Apps
No risk management, no account. Tools like Position Size Calculators help me figure out how much to trade without sweating bullets. Setting automatic stop-losses is a lifesaver, too, it’s like a seatbelt for your portfolio.
4. Sentiment Tools
Ever wonder what the crowd’s thinking? Platforms like Lunar Crush or even scanning X for trader chatter can clue you in. When everyone is hyped to the moon, you can start looking for the exit. Too much gloom? Might be time to buy.
Indicators are where the magic happens, but they’re not crystal balls. You can group them into four buckets, trend, momentum, volatility, and volume. Mix and match wisely, and you’ve got a recipe for better trades.
- Trend Indicators: Finding the Market’s Groove
These tell you where the market’s headed and if it’s got legs.
Moving Averages (MA): You can use the Simple Moving Average (SMA) for a smooth look at the past, say, 50 days. The Exponential Moving Average (EMA) is a pick for catching shifts faster.
Ichimoku Cloud: Sounds fancy, but it’s a beast for spotting trends and support levels. Price above the cloud? You can be optimistic. Below it? Time to be cautious.
2. Momentum Indicators: Gauging the Gas Pedal
These show how fast prices are moving and when they might be running out of steam.Relative Strength Index (RSI): Runs from 0 to 100. Over 70, and the market’s getting frothy, maybe time to sell. Under 30? Could be a bargain. My favorite trick is spotting divergences, if the price hits a new high but RSI doesn’t, the rally’s losing juice.
MACD: This one tracks two EMAs to spot momentum shifts. When the MACD line crosses above the signal line, I’m looking for buys. It’s like a green light for bullish vibes.
3. Volatility Indicators: Riding the Waves
Markets can be calm one day, wild the next. These help you navigate the swings.
Bollinger Bands: Picture a moving average with bands above and below. When they tighten up you have caught some sweet breakouts this way.
Average True Range (ATR): This one tells you how much the market’s jumping around. If ATR’s climbing, you widen your stop-loss to avoid getting whipsawed.
4. Volume Indicators: Checking the Crowd
No volume, no conviction. These confirm if a move’s got real muscle.
On-Balance Volume (OBV): It’s simple, volume goes up on green days, down on red. If OBV’s rising with price, the trend’s legit. If it’s flatlining, I’m skeptical.
VWAP: Day traders, this one’s for you. It’s the average price weighted by volume. If the price is above VWAP, the market’s strong; below, it’s weak.
Putting It Together: Trading Playbook
Here’s how you can make these puzzle pieces fit. Let’s say you are eyeing a stock.
- Check the Trend: Is the 50-day EMA above the 200-day? Is the price above the Ichimoku Cloud? If yes, you are in bullish territory.
- Time the Entry: Wait for RSI to dip below 30 in that uptrend, cheap prices in a strong market.
- Manage the Exit: I set a stop-loss based on ATR, trailing it as the price climbs to lock in gains.
The key? Don’t overload your chart with 10 indicators. Two or three that play nice together are plenty. More than that, and you’re just confusing yourself.
Mistakes I’ve Made
Many of us have blown up accounts and learned some lessons the hard way. Here’s what to watch out for.
- Chasing Lagging Signals: Moving averages are great, but in a choppy market, they’re like driving with a foggy windshield. Pair them with something real-time, like order flow if you can get it.
- Forgetting the Big Picture: An oversold RSI in a crashing market doesn’t mean “buy.” It might just mean “crashing harder.” Always zoom out.
- Over-Tweaking: A strategy to nail every dip in 2020 flopped in 2021. Markets change, don’t marry your setup.
The Future: AI’s Cool, But Don’t Ditch Your Brain
Lately, many are dabbling with AI tools like Trend Spider, which spots patterns I’d miss after three cups of coffee. Some platforms even scan X or news for sentiment, pretty wild. But AI’s a helper, not a boss. You should always double-check its calls with your trusty indicators. Tech’s great, but trading’s still about judgment.
Wrapping Up
No tool or indicator will make you rich overnight. What works is learning your tools inside out, staying disciplined when the market’s screaming at you, and tweaking your approach as things evolve. It’s like woodworking, you start with rough cuts, then refine until it’s a masterpiece.
So, grab a charting platform, pick a couple of indicators, and start small. Test your ideas, learn from your losses and let the data guide you.
All blogs
©TRUST TRAINING AND DEVELOPMENT INSTITUTE 2026
Disclaimer: Trust Institute is a KHDA-licensed educational institution based in Dubai, UAE. All training programs, materials, and content offered through our website and in-person sessions are provided strictly for educational purposes. We do not offer financial or investment advice, and we do not engage in or promote any trading activity.
Our courses are designed to increase knowledge and understanding of financial markets. Trust Institute is not a brokerage firm, does not manage client funds, and does not participate in any trading on behalf of its students.
Participation in financial markets, including Forex trading, involves significant risk and may not be suitable for everyone. Individuals are encouraged to conduct their own research and consult with licensed financial professionals before making any financial decisions.
By accessing our content or enrolling in our courses, you acknowledge and accept that Trust Institute is not liable for any financial outcomes resulting from the application of educational material shared. You agree that your use of this information is at your own discretion and responsibility.
Trust Institute is fully licensed and regulated by the Knowledge and Human Development Authority (KHDA) in Dubai, United Arab Emirates.


